It becomes a new challenge for the organization to make sense of the millions of log lines. In addition, log management became more critical to monitor system and application performance and security risk. On the other hand, log management may be very time consuming with traditional methods.
If you need Enterprise solution, there are too many options that you can integrate to your platform. Please check this link for more information.
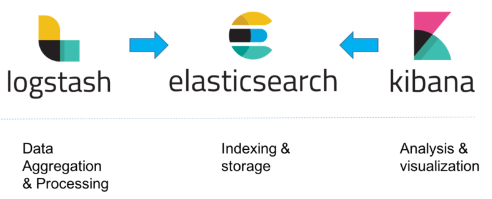
Open-Source software Rsyslog, Elasticsearch, Logstash, and Kibana provide the same functions that you can transport, transmit, store and visualize systems and application logs.

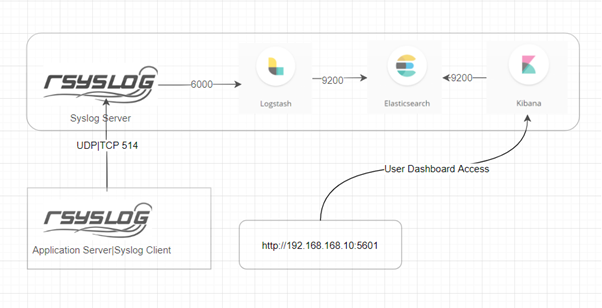
You should take a look at this flowchart to figure out how ELK and syslog work together. I basically added how the log was transmitted between all layers.

For small-sized development, the ELK architecture will look as follows:

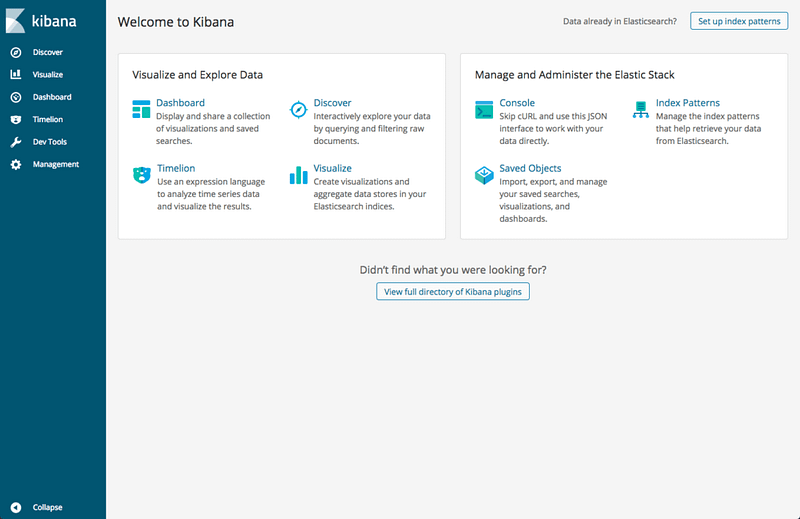
You may want to check this documentation for more technical details. After following installation steps, open up Kibana in browser with “http://<kibana_Ip_address>:5601” . You will be presented with the Kibana home page. From the management tab, you will be able to manage your Elasticsearch indices.


