In this post we will perform these tasks:
- Install and configure Syslog Server
- Use Logstash to format logs
- Use Elasticsearch to manage logs
- Use Kibana to visualize logs
Prerequisites:
- Linux Operating System (Ubuntu, Fedora, Centos, RHEL, etc.)
- Client-server which forward application or system logs
- Syslog Server to collect client forwarded logs
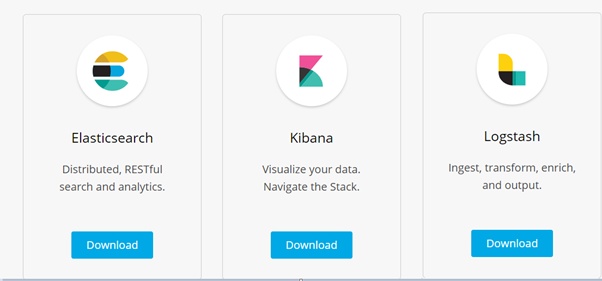
- Download ELK binaries from this link
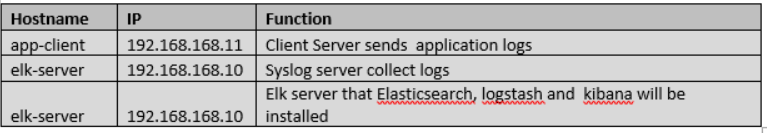
We will perform ELK installation on Syslog Server. But you should check your configuration if you plan to deploy installation on production. You may separate Syslog server and elk server on production.
Step 1: Download and Install ELK Binaries
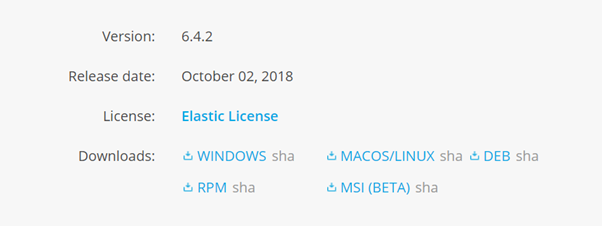
Before start installation, you need to download binaries from this link. When you click the download button then you need to select your Linux base binary file. For the Debian based Linux server choose the DEB file. Centos, Fedora, RHEL use the RPM base package.
a.Elasticsearch Installation

Check this link for “how to install and configure elasticsearch?”
b.Logstash and Kibana Installation
You can perform default installation steps for Kibana and logstash. Download binaries from this link then use “rpm” for fedora base and “dpkg” for Debian base command to install the application.
Fedora Base Linux Server:
#rpm -ivh <kibana.x..rpm>

#rpm -ivh <Logstash.x.rpm>
Debian Base Linux Server:
#dpkg -I <kibana.x..rpm>

#dpkg -I <Logstash.x.rpm>
c. Configure Logstash and Kibana
I added a simple configuration for Kibana and logstash. You should check the manual page to find out which attributes you need and how to use it.
Kibana:
Server Port: 5601, we will connect the Kibana dashboard from this port. You can change it as you wish
Server Host: Define host information to open sockets. You should define your ELK server IP address.
Elastichsearch URL: Define your elastichsearch server’s ip address and port.
#cat /etc/kibana/kibana.yml |grep -v ‘#’

server.port: 5601

server.host: “192.168.168.10”

server.name: “logman.casesup.com”

elasticsearch.url: “http://localhost:9200"

#systemctl restart kibana
Logstash:
I did not change any configuration on logstash YML file. We only need to define our logstash log format to manage apache and Syslog logs.
I added an example of logstash configuration for Apache logs and syslogs. After define configuration, you should restart logstash. Logstash will be open TCP 6000 port and capture incoming logs. Then it will forward the formatted logs to elastichsarch.
# cat /etc/logstash/conf.d/logstash-apache.conf
input {
tcp {
host => “127.0.0.1”
port => 6000
}
udp {
host => “127.0.0.1”
port => 6000
}
}
output {
elasticsearch { hosts => [“localhost:9200”] }
stdout { codec => rubydebug }
}
Step 2: Configure Syslog server and client
First, I will explain how to configure Syslog server to redirect incoming logs to the logstash, which we explained above (Port: 6000)
This package must be installed on your server. Please check if you have already installed rsyslog package to your system both client and server.
# rpm -qa|grep rsyslog
rsyslog-8.24.0–16.el7_5.4.x86_64
#systemctl enable rsyslog
#systemctl start  rsyslog
After package installation then defines a module that redirects all incoming logs to the logstash daemon.
The facilities local0 to local7 are “custom” unused facilities that Syslog provides for the user. If a developer creates an application and wants to make it log to syslog, or if you want to redirect the output of anything to syslog (for example, Apache logs), you can choose to send it to any of the local# facilities. Then, you can use /etc/syslog.conf (or /etc/rsyslog.conf) to save the logs being sent to that local# to a file, or to send it to a remote server. More
At this example, we used local6 to redirect the output of application logs on client site. We perform installation ELK and rsyslog server at the same machine. Therefore, we defined “127.0.0.1”.
Rsyslog Server Side Configuration:

# cat /etc/rsyslog.d/logstash_apache.conf
local6.* @127.0.0.1:6000
# cat /etc/rsyslog.conf |grep -v ‘#’

$ModLoad imudp
$UDPServerRun 514
$ModLoad imtcp
$InputTCPServerRun 514
$WorkDirectory /var/lib/rsyslog
$ActionFileDefaultTemplate RSYSLOG_TraditionalFileFormat
$IncludeConfig /etc/rsyslog.d/*.conf
$OmitLocalLogging on
$IMJournalStateFile imjournal.state
*.info;mail.none;authpriv.none;cron.none /var/log/messages
authpriv.* /var/log/secure
mail.* -/var/log/maillog
cron.* /var/log/cron
*.emerg :omusrmsg:*
uucp,news.crit /var/log/spooler
local7.* /var/log/boot.log
#systemctl restart rsyslog
Rsyslog Client Side Configuration:

First, create rsyslogd modules to collect application logs.
# cat /etc/rsyslog.d/apache.conf
$ModLoad imfile
$InputFilePollInterval 10
$PrivDropToGroup adm
$InputFileName /appdata/casesup/apache_application.log
$InputFileTag applogs_log
$InputFileStateFile applogs_log
$InputFileSeverity applogs
$InputFileFacility local6
$InputRunFileMonitor
$InputFilePersistStateInterval 1000
Last step, define rsyslog server to send application logs.
# cat /etc/rsyslog.conf |grep @
local6.* @192.168.168.10:514
#systemctl restart rsyslog